
Data is key to CanDIG’s operations. CanDIG is constantly receiving data from various sources, including different clinical trials. In the past year, CanDIG received data from over seven different clinical trials. About 97% of all cancer data is recorded in Electronic Health Records (EHRs) in various institutions and cohorts. The data in these institutions and cohorts all differ in data models and standardizations. This poses an issue for the analysis and reporting of health related research. A solution includes developing strong and maintainable data pipelines to effectively convert cohort data into a standard data model. This would ensure a meaningful exchange of health information within a shared framework and make analysis and reporting of oncology-related research more effective.
Overview of CanDIG’s Data Pipeline
Data pipelines are a set of actions that process the data from different sources into the desired output. One type of data pipeline is ETL, which stands for extract, transform and load. Extraction involves taking the data from several heterogeneous sources. The next step involves transforming the data into a usable resource by cleaning and conforming the data to a standard model. The last step is to load that data into the system so that it can be used for applications, analytics, or machine learning algorithms. ELT is another type of data pipeline, similar to ETL except the transformations take place after data is loaded into the system. ELT comes in handy when there is a misalignment in supported data types between the source and destination or for speed and efficiency as load and transform can be performed simultaneously. There is no defined way of building data pipelines, each pipeline is unique based on schema, model, and standardization requirements. Figure 1 provides an overview of CanDIG’s current data pipeline.
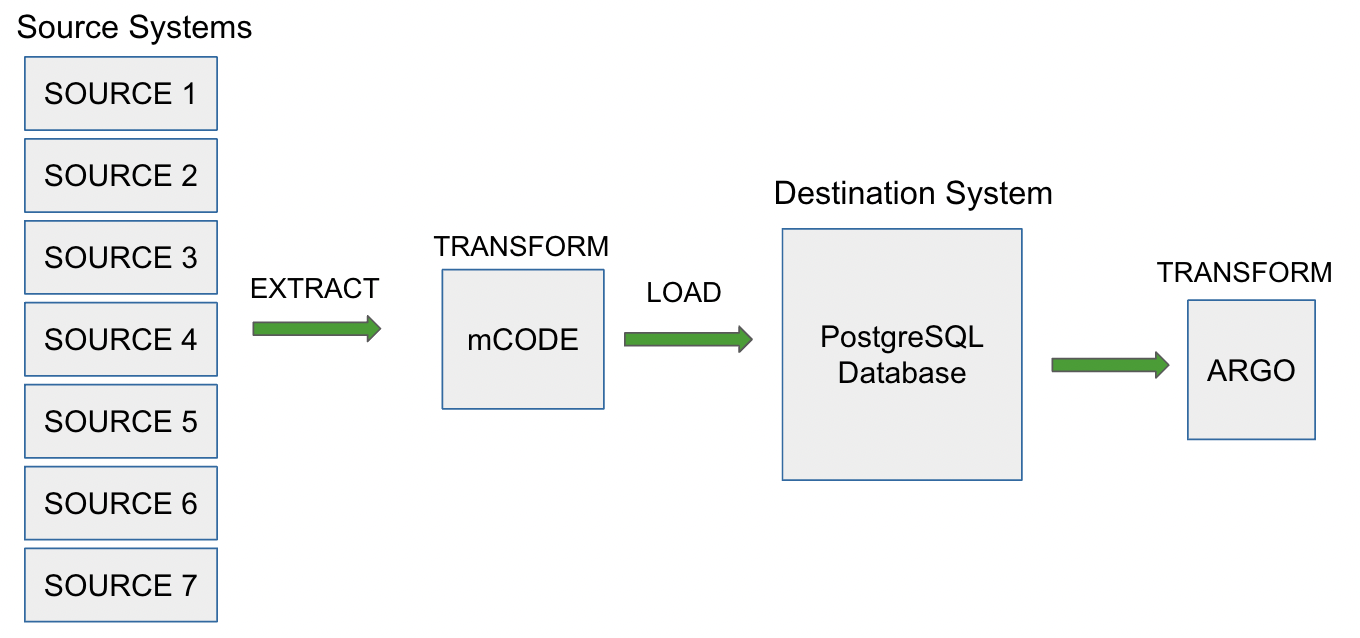
CanDIG uses a combination of ETL and ELT pipelines to transform data. The first step requires the extraction of data from the cohorts followed by a transformation into mCODE. The current project requires cohort’s data to be translated to a data model based on a version of ICGC-ARGO. Although, the internal data model for CanDIG’s metadata service, a PostgreSQL based database (Katsu) supports mCODE.
Hence, the next step after ingestion would be to use Katsu’s rendering functionalities to render the data in ICGC ARGO format. This method allows data from cohort to ARGO without altering the schema of the destination source. This hybrid pipeline is particularly effective as data models are not yet stable and changing or adding to the schema of our destination source is a time-consuming process. In this particular project, we are developing the data pipeline while the model is still being refined, so we need to be able to handle future model changes
Step 1: Extract Data from Sources
When building the pipeline it is preferential to start one cohort and complete the entire process. In the future, we will integrate some reusable functions and use them for multiple cohorts. One cohort of data usually has multiple flat files (i.e., biochemistry results, demography, ECOG performance status, etc). For the ease of extracting, it is best to have one flat file. This can be automated with a script that combines multiple excel files into one excel file with multiple sheets.
Step 2: Translate to mCODE
Once extraction is complete, transforming clinical cohort data into mCODE can begin. The clinical ETL tool build makes the process easier. We start off filling this mapping template. To start, create a folder that includes the following three files:
A. Make a mapping template CSV file that follows this format. The value on the left is the mCODE element and the value on the right is the cohort element with its transformation function. Some transformation functions can be reused, such as single_val. This function takes in the value at mapping elements and combines into one and returns it. The date function that standardizes the ISO standard, Whereas all other transformation functions are cohort-specific and must be defined in a separate file.
## mcodepacket element, function(column-name)
## (.0 is an array element) (* is required) (+ denotes ontology term)
id, {single_val(Subject)}
subject.id*,{single_val(Subject)}
##"subject.alternate_ids,
subject.alternate_ids.0,
subject.date_of_birth, {mappings.date(PER_BIR_DT_RAW)}
"subject.age","##The age or age range of the individual -- TO ADD."
subject.sex,{COHORT.sex(PRSN_GENDER_TXT_TP)}
B. Make a file that includes all the special mapping functions for the specific cohort. The following is an example of a simple special function that can be included in this file.
def vital_signs_node(mapping):
    vital_signs_dict = {
        "PRSN_WT_VAL": "weight",
        "PRSN_HT_VAL": "height",
        "SYST_BP_VAL_RAW": "systolic_blood_pressure",
        "DIAST_BP_VAL_RAW": "diastolic_blood_pressure"
    }
    new_dict = {}
    for item in vital_signs_dict:
        if item in mapping:
            mapping_val = mappings.single_val({item: mapping[item]})
            if mappings.is_null(mapping_val) is False:
                new_dict[vital_signs_dict[item]] =  mapping_val

    if new_dict == {}:
        return None
    else:
        return new_dict
This function takes in vital signs from different columns and saves them in a dictionary with mCODE appropriate schemas. In addition, it makes sure to check for null values before returning the dictionary. Some other examples of transformations might include: removing duplicate values, accounting for missing values, returning ontology codes, performing calculations, and combining or splitting up values of data.
C. The last step is to make a manifest file containing mapping functions used and mapping template files as shown below. Once this is done, the tool can be run by passing in the input dataset and manifest file.
description: Mapping of COHORT dateset to mCODEpacket format for katsu ingestion
mapping: COHORT2mCODE.csv
identifier: Subject
functions:
  - COHORT
Step 3 & 4: Load and Render ARGO Data
Finally, the last two steps are to ingest the mCODE packet received into the destination source (Katsu) and use its rendering functionalities to render the data in ARGO format. This process can be automated with a python script and is reusable across cohorts. Hence, the only changes in the pipeline between cohorts would be the individual transformation functions. Below an example of some synthetic data rendered in ARGO JSON format.
{
    "composition_objects": [
        {
            "donor": {
                "submitter_donor_id": "INS-001",
                "vital_status": true,
                "gender": "Male"
            },
            "primary_diagnoses": [
                {
                    "submitter_primary_diagnosis_id": "1000-0",
                    "cancer_type_code": {
                        "id": "SNOMED:103329007",
                        "label": "Not available"
                    }
                }
            ],
            "treatments": [
                {
                    "submitter_treatment_id": "1000-0",
                    "treatment_type": "Radiation therapy",
                    "radiation_therapy_modality": {
                        "id": "SNOMED:103329007",
                        "label": "Not available"
                    },
                    "anatomical_site_irradiated": "TONGUE BASE"
                },
Best Practices while writing ETL Pipelines
1. Understand and Analyze Source: Before implementing the data pipelines, it is important to understand data types, schemas, and standardizations of sources and destination data models. It is also important to understand the mappings between the two data models to efficiently transform them.
2. ETL Logging: ETL logging includes documenting all events that occur before, during, and after the ETL process. This allows us to trace back steps and identify issues or improvements more effectively. Also, this is beneficial for identifying inconsistent or missing data more effectively.
3. Checkpoint for Recovery: Unexpected errors or failures are very common when moving large amounts of data. Setting up checkpoints between significant events helps keep track of where the error occurred so that the process does not have to restart from the beginning. This is particularly true in the CanDIG data pipeline, which uses multiple data models; it is useful to have checkpoints between data models.
4. Modularity: Modularization involves abstracting ETL processes into smaller reusable blocks, such as the individual python scripts, or general transformation functions, like date. This allows us to reuse a single block of code for multiple processes and reduces duplication in future work. It also makes it easier to test our code using unit testing leading to more accurate results.
Final Thoughts
Upon further inspection of cohort data and the ARGO rendered, we see that there is a slight data loss. We can attribute this to the fact that there are elements in the ARGO data model that don’t exist in mCODE, but when cohort data was translated to mCODE, this data was lost. Although the data loss is limited, one way to prevent this would be to use the clinical ETL tool directly to transform the data into ARGO instead of mCODE. To do so, the destination source Katsu must support the ARGO ingestion. This can be implemented either in the existing service or a new service entirely. A NoSQL based service might be one option to support heterogeneous or dynamic data.
For any questions, feel free to contact us at [email protected] or on Twitter at @distribgenomics.